
Syllabus Lectures: T. 1310-1500, R. 1610-1700 @ SE A211 Instructor: Yu-Ling Tseng. Office Hours: T. 1200~1300 R. 1500~1600@SE A409 TA: (負責聽用R講解習題) 吳雨瑾 T. 15:00~16:00 @ SE B302 蔡 念秤 (負責打作業分數) W. 15:00~16:00 @ SE 412~ 有問題要多多請教助教喔 數學小天地 ~~ 討 論 各類 數學相關問題 的好地方 ~~
Prerequisites: Probability Theory, Statistics, Linear Algebra YesKno時間 有點迷路時聽聽第一堂課的也許有幫助,請直接收聽第29集: https://play.kkbox.com/podcast/episode/9XiNiBkrgcwXNDx5MA

期 末考相關:
I
上 機考試時間 0605(星 期四):
16:10 ~ 16:50
在系電腦教室考
每組 代表
應考同學 請 務 必 以USB攜帶課本的所有資料檔案來考試,
請 提早(電腦教室15點開始
借)
到電腦教室挑選要用的電腦,並將你覺得需要的檔案先放到電腦桌面,方便考試時的參考。
上機考試:open book, open notes, open web, open
anything........
每 組代表應考同學已隨 機 抽選 如下:
101 賴聖哲 102 陳漢瑒 103 施智皓 104 鄭仲傑 (*)105 黃騰緯 106 林修弘 107 鄭嘉勛
0506
期中考成績枝葉圖
人
數: 28 (不計缺考人數)總分:110
0 | 0055
1 |
2 |
45
3 | 349
4 | 477
5 | 03788
6 | 0048
7 | 14
8 | 1269
10|4
~~~~~~~~~~~~~~~~~~~~~~~~~~~~~~~~~~
學 期只有17周上課時間,學校行事曆18周的彈性補課我們就安排如下。。。。
星期二都 13 點 整 開始上課 ~~~ 題目選擇方式 講解流程
Data sets in txt form
| (date discussed in class)
Programs |
Description | Code with Output in HTML |
| (20250306) SetUp(1) | SetUp(1)shows
you how to: 1. devide graphical windows (not necessary if using R studio where you use the left program with extension .r) 2. assign variables/sequences 3. plot and make titles for the graph 4. generate normally distributed observations/make histograms 5. do simple regressions and related plots (you should see the effect of sample size and s.d. on the fitted reg. lines) 6. quit R |
SetUp1html |
| (20250320
) SetUp(2) ch01ta01 data |
SetUp(2)shows you
how to: 1. scan a data set in your working directory into R 2. get figures and tables in the textbook with the Toluca Company examples 3. construct confidence intervals for reg. coeff.'s, confidence/prediction intervals for the mean response at given predictor x's values 4. construt conf. band for the entire reg line, 5. overlay three type of intervals in one plot for better comparison 6. save the output to a file for preparing your homework, or save the R commands for later use |
SetUp2html SetUp2pdf |
| (20250424) MLR ch06fi05 data |
MLR
shows you how to 1. some basic matrix operations in R, 2. how to obtain the design matrix after fitting a simple linear regression model, With the Dwaine Studios examples 3. do multiple linear regression 4. get figures and tables in the textbook 5. make basic scatter plots for M-L-R data analysis 6. obtain the design matrix 7. get (simultaneous) conf. intervals for reg. coefficients, confidence/prediction intervals for the mean response at given predictors's values |
MLRpdf |
| (20250501)GLT ch6pr18 data |
GLT shows you how
to 1. obtain SSEs from the full model and the reduced model 2. obtain F(1-alpha; m, k) in R 3. use the general linear test approach for testing certain hypotheses (by giving 3 examples) |
GLTpdf |
| (20250520) ResidPlot | This program ResidPlot 1. let you get a feeling as how a random sample of size n from N(0, 1) would look like in time sequence plots, and in histograms; and 2. with simulated regression data..... shows you some basic residual-plots for diagnostic in a regression analysis Please note that how a violation of certain assumptions made in reg model affect the display........ |
|
| GOFBFtests CookDBetaOutliers 20250520 Yes's note |
These notes are for 1. testing the constant variance assumption/GOF test in a multiple linear reg model 2. stat measures to identify influential points |
|
| (20250522)varstabtrans ch3ta10 data |
This program varstabtrans
illustrates a complete process when analyzing a real data
set with nonconstant variance problem........ Instead on using W.L.S.E. (which is covered in WLSE), we try transformations when nonconstant variances occur in this program. We run through the Case Example -- Plutonium Measurement on p 141 of textbook. Esp. you learn how to delete some data points from a data set, how to update model , and how to get basic diaqnostics residual plots. |
varstabtranspdf |
| (20250527/29)
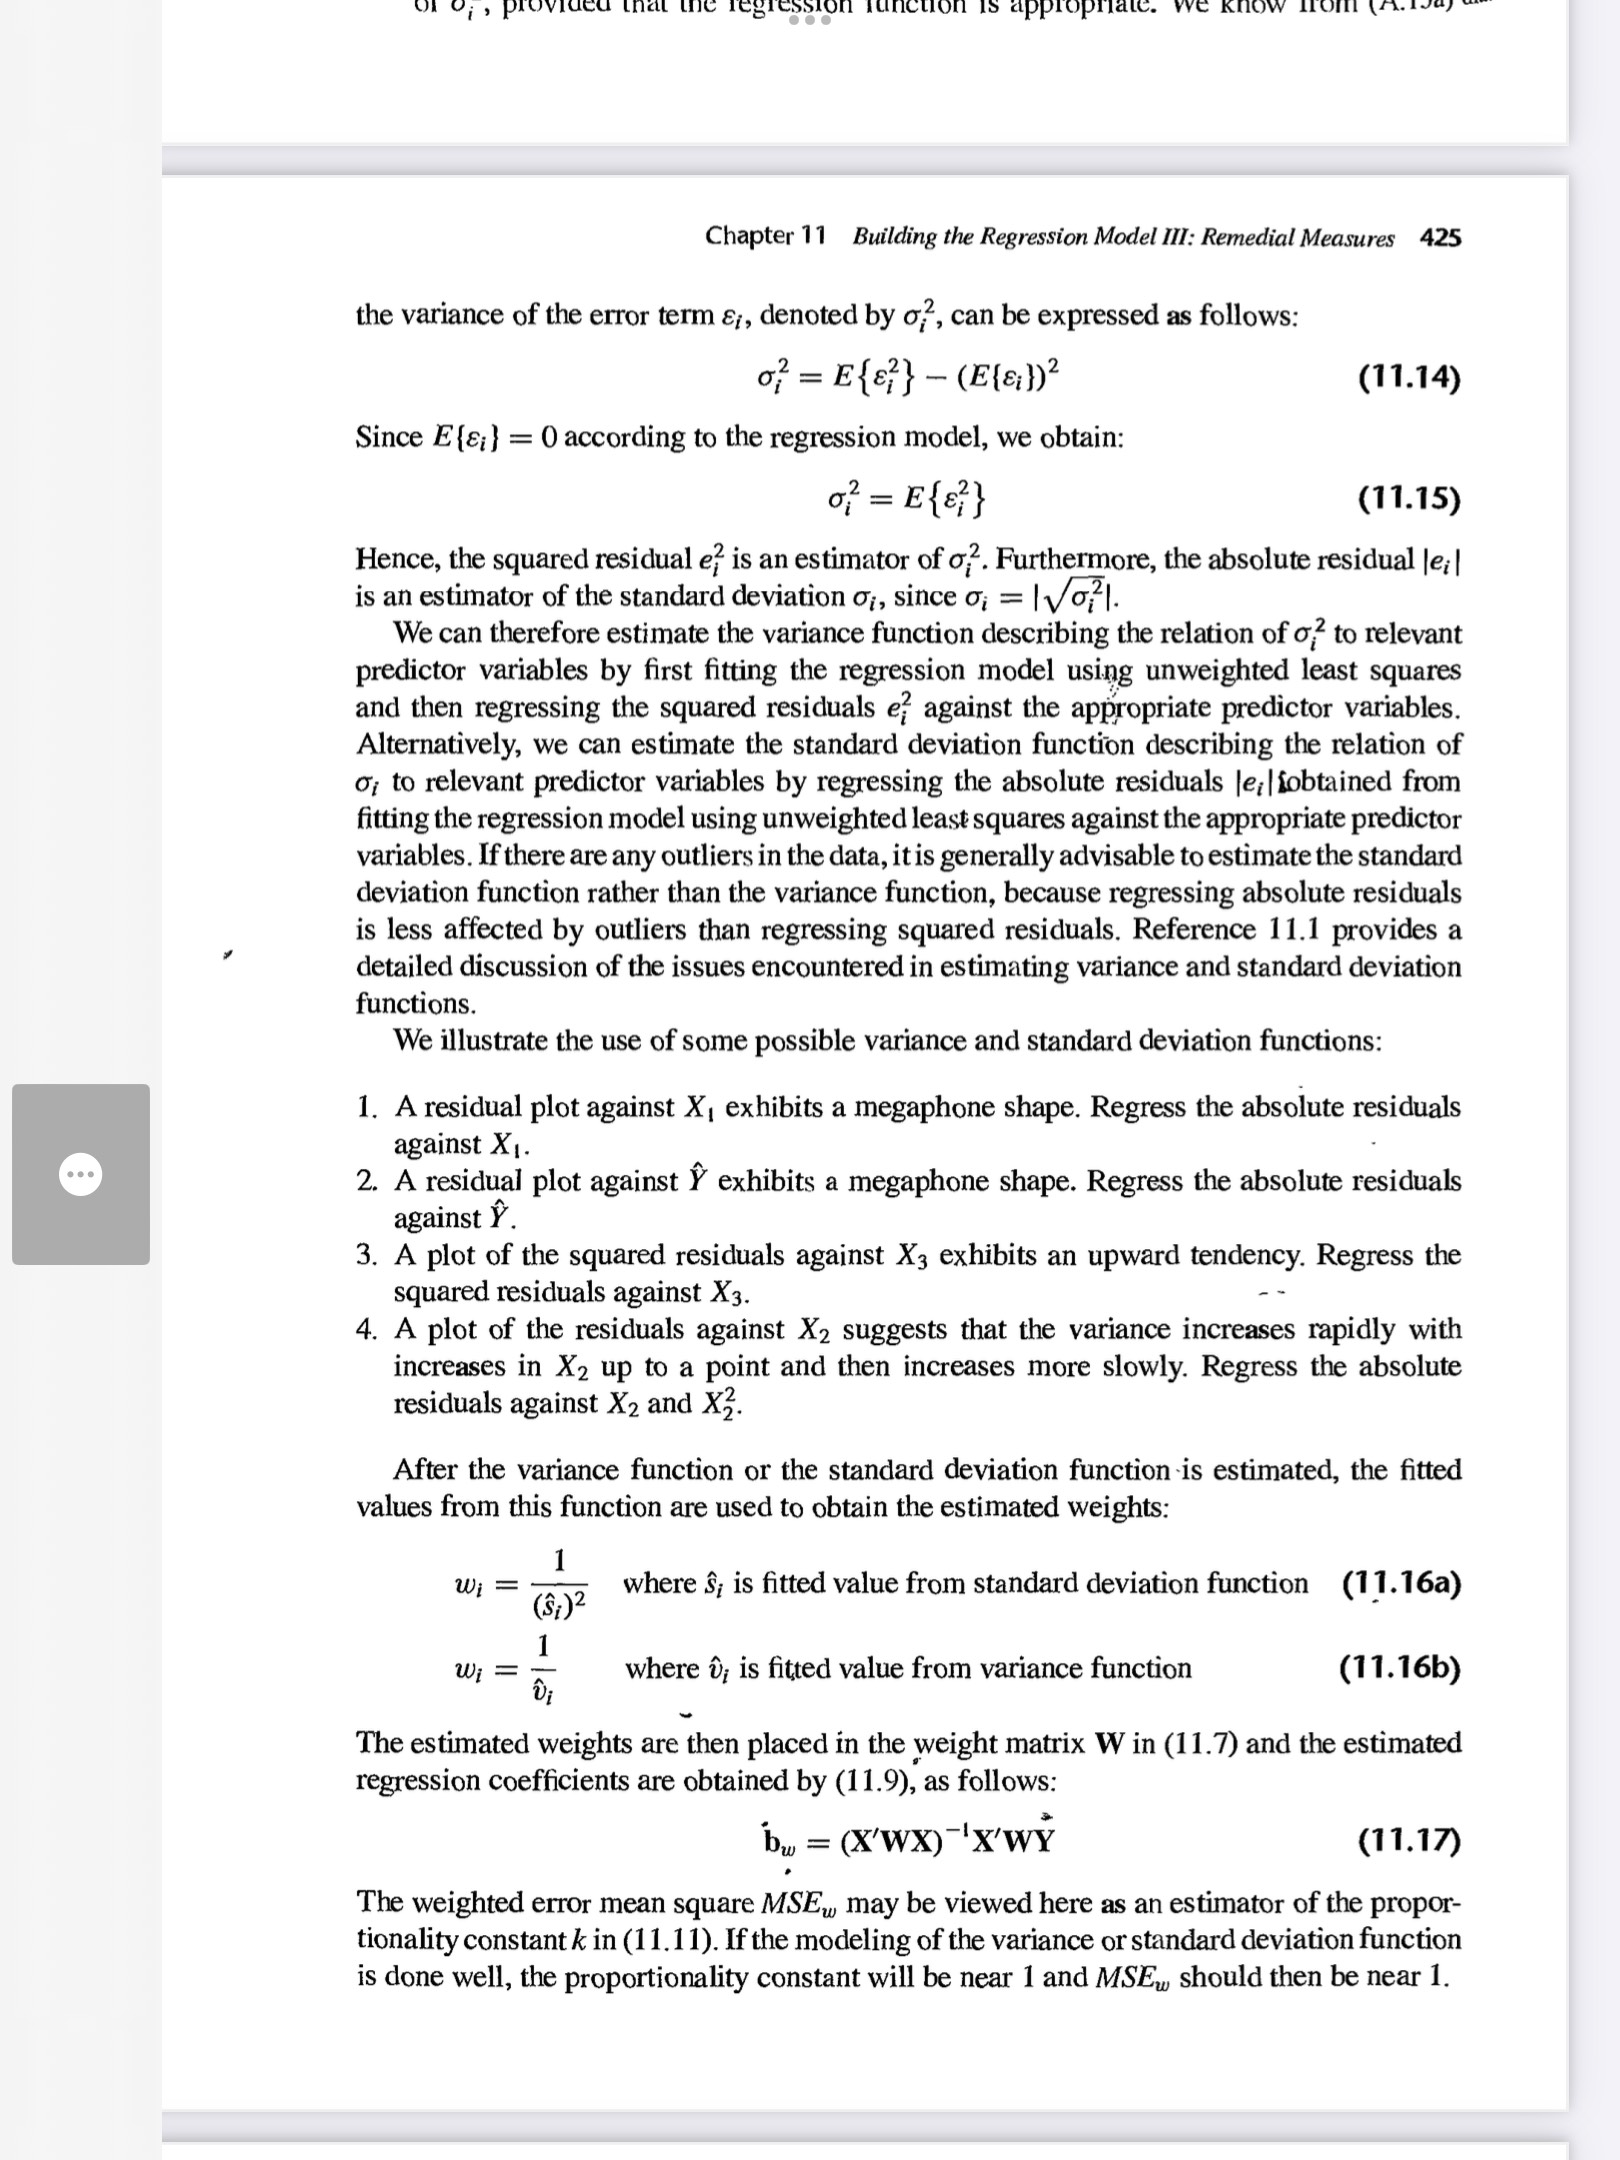
WLSE ch11ta01 data |
WLSE shows you how
to do W.L.S.E. when non-constant variances occurs...... esp. shows you how to get figures and tables in the textbook with Blood Pressure Example on p427 . |
wlsepdf reg.wlse.estsd |
| Date |
Problems 『作 業成績10%由各組派一代表和 助教 吳雨瑾面
試講解一題要用R程式回
答的問題;題目採先選先贏制,講過題目其他組不得再選擇喔 ( 吳雨瑾 office hour T. 15:00~16:00 @ SE B302 時間若不行請另行和助 教email約時間)』 |
Due date |
| 0527 |
Ch.3 : 9 In R, sum((fitted.values(fm)-mean(y))^2), sum(residuals(fm)^2) give you SSR and SSE, respectively; where y denotes the response variable and fm is the fitted model obtained from lm(y~.....) Ch.10 : 24 Ch.11 : 6 (a~f), 7(a~f), 13, 17 |
這
份作業不用交。 但,同學 一 定 要 自 己 做過這些題目喔 |
| 0520 |
NOTE: When asked to
draw a dot plot in this homework, you may draw the
stem-and-leaf plot, instead. In R, stem(x) gives you the stem-and-leaf plot of data in x. Ch.3 : 3 (a, b, c, d.) (For d, only need to prepare a normal probability plot, i.e. the Q-Q plot) 4 (a, b, c, d, e, f, h) (For e, only need to prepare a normal probability plot, i.e. the Q-Q plot) 6 (a, b, c.) ( For c, only need the Q-Q plot) 8 (a, b, c, d). ( Only Q-Q plot for d) |
0527 |
| 0430 |
Ch.6 : 6 (c), 11 (b), 16 (b, c), 17, 19 | 因期中考將近,這 份作業就不用交囉,同學請自行練習。 |
| 0422 |
These
Problems
and Ch.2 : 27 , 28 Ch.6 : 4, 5 (a, b), 6 (a, b), 7, 15 (c), 16 (a), 26 |
0501 |
| 0410 |
Ch.5 : 17, 18. 19 Ch.6 : 2, 22, 23, 24, 25 |
0422 (星期二) |
| 0320 |
Ch.1 : 19 (已被選), 28 (已被選), 45(已被選) Ch.2 : 4 (已被選), 8 (a, c), 10, 13 (已被 選) , 23 (a, c)(已被 選) |
0401 (星期二) |
| 0306 |
Ch.1 : 7, 8, 33, 34, 39 (a) , 41 Ch.2 : 3, 17. |
0320 |
課本:Applied Linear Statistical Models, Applied Linear Regression Models, 5th ed, Kutner, Nachtsheim, Neter and Li, 2019, McGRAW-HILL International. 洽華泰書局 周益彰 先生(0910-275877)
參考書目:
1. Applied Regression Analysis, 2nd ed, Draper, N. R. and Smith,
H., 1981, Wiley.
2. Introduction to Linear Regression Analysis, 2nd ed, Montgomery,
D. C. and Peck, E., 1991, Wiley.

